Do you know:
- Your current net worth?
- How much money do you have in the bank?
- Which are your most profitable investments?
- Which investments do you currently have?
- How much of your revenue (e.g. salary) contributes to your wealth?
- How did the above evolve over time?
If coming up with the above answers is hard, or their values are fuzzy, then it might be time to revamp your investment tracking.
This article will:
- share a Google Spreadsheet template to track your investments, and explain it
- provide a guide on how to use it
- suggest a simple process to make sure the above questions will not be a problem anymore
The Template
Get it
- Download / copy the Google Sheet Template here
- How to use it
How it is structured
The template has several sheets, which are built to have the essential tracking elements that can be immediately used, while also allowing for extensibility for your own custom case.
Dates sheet

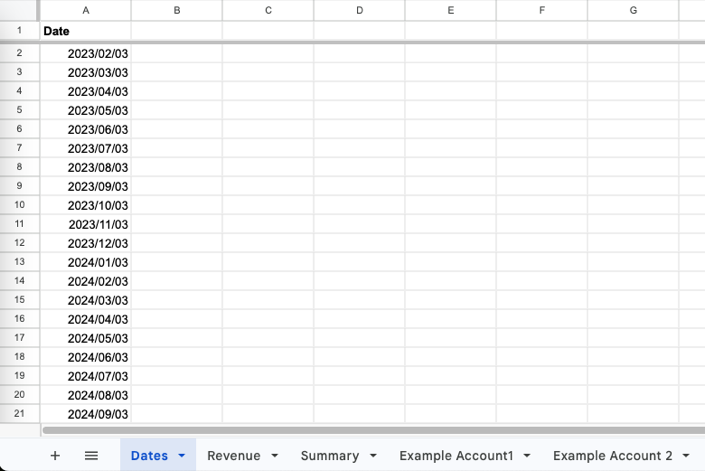
The entire sheeet revolves around these dates. Each of these represents the temporal snapshot of all your assets. All the other sheets use these dates as the starting point for their values, and this would be first thing you would add whenever entering a new series of entries
Revenue sheet

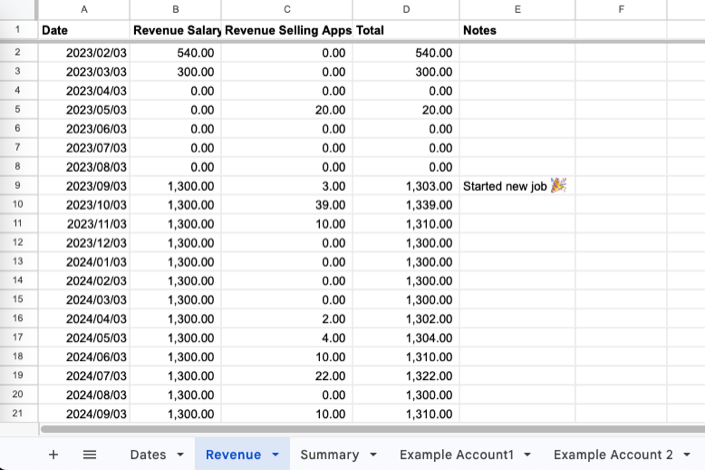
Represents all the resources coming in, which are not a result of your investments. This could be the income from your salary, side-hustle, the app you are selling on the app store, etc.
Account sheet

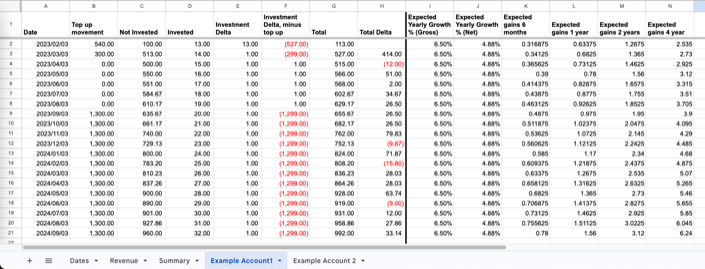
There are two example account sheets provided with the template, each representing a different account on your portfolio, but you can add how many you would need. These could be your bank account, transaction broker, private pension, etc. To create a new one, grab one of the example account sheets, and copy it into a new spreadsheet.
On the template, the Example Account1 shows how a bank account could roughly look like, and Example Account2 how an investment platform (such as Vanguard) could look like.
Each of the account sheets is structured in the following way:
- Current status: a look at the present, and comparison with the last update
- Date Column: referenced from the dates sheet, representing the date of this current snapshot
- Top up movement: any money that you deposited in this account since the last date, would be accounted for here. For example, salary that is deposited, on deposits made in an investment broker. The objective here is to keep track of the money coming into a specific account, so that its performance doesnt look better than it really is.
- Not Invested: all uninvested money sitting in the account. For example, money in a bank account which does not yield interest.
- Invested: all money invested in this account. For example, the amount of money invested in a transaction broker, which is currently invested in stocks or ETFs.
- Investment Delta: the investment difference between the current date and the last date.
- Investment Delta, minus topup: the investment difference between the current date and the last date, minus the top up. This value attempts to represent how much money was actually generated by the investment since the last date.
- Total: the total invested and not invested amount in the account.
- Total Delta: total difference between current date and last date.
- Expected gains: predictions of investment gains
- Expected Yearly Growth % (Gross): for example, if overall the invested money is in a Fixed Term Deposit, this value would represent the gross yearly interest accrued from it, pre-taxes.
- Expected Yearly Growth % (Net): this value represents the actual expected gains from this investment. For example, taking the Fixed Term Deposit example above, this would be the expected yearly interest, after taxes.
- Expected gains 6 months / 1 year / etc: taking into consideration the Expected Yearly Growth % (Net), which would accrue gains from the investment over these time spans.
Summary sheet

This is where it all comes together. All the accounts are summed up, resulting in these new relevant columns:
- Total: the total across all investments, for a given date
- Total Delta: total difference between current date and last date.
- Total Delta minus Revenue (i.e. profit / loss): the aim of this column is to roughly represent how much of your net worth is being eaten up by your expenses:
- If this value is negative, it means that either your costs are too high, your investments are not yielding yet high values, or both.
- If this value is neutral, it means that your overall investments are completely covering your costs.
- If this value is positive, it means that your overall investments are not only covering your costs, but are also increasing your net worth on top.
How to use it
Set up
- Copy the template, by opening it and clicking on File -> Make a Copy
- Go to the dates sheet, and leave only the top two dates. The first date would be the previous month, and the second would be the current month. Delete the rest.
- Go to the other sheets, and delete all the rows which don’t have a date now
- Zero out the first line on each of the account sheets for Top up Investment, Not Invested and Invested.
- Zero out the first line of the revenue sheet; or add your revenue from that month.
- Use the existing example accounts to host your own accounts. If a new account is needed:
- Copy one of the account sheets, by right clicking on the sheet’s tab, and selecting Duplicate
- Add a new column to the summary sheets, representing the new account. Change its formula’s value to get the information from your new sheet. You can do this by selecting the cell and changing the name of the referenced sheet, to the name of your new sheet. For example, from
'Example Account 2'!G2to'Monzo Bank Account'!G2. - Still in the summary sheets, double click the chart, select the Setup tab, and add the range of the new column to the list. For example, if the new column was on the D column, then the data range would change from H7,A2:A1000,B1:B1000,C1:C1000,G1:G1000 to H7,A2:1000,B1:B1000,C1:C1000,D1:D1000,G1:G1000. Then, on the Series section of the Setup tab, click on Add Series and add the one from your new account.
Recurrent workflow
Once you have the above set up, I suggest that on the first days of every month, right after your main source of income is deposited (e.g. salary), that the sheet is updated with the current values of each of the accounts. This is key, and using a recurrent calendar event will help you make sure this is done. If this update is not made periodically, eventually there will be gaps in the tracking, and its data will lose relevance. The process would look something like this:
- Add the current date to the dates sheet
- On each the the accounts, expand the date to the new one, and fill in the current Top up Investment, Not Invested and Invested values
- All done!
Final thoughts
Feel free to expand and customize the above tracker to your needs, and let me know how it could be improved and which was its impact on your investment tracking. Would love to hear your thoughts about it.